Serious writing for
serious readers
Summary
12 August 2012
Each month the Institute of Islamic Banking and Insurance (IIBI) puts on a free evening lecture in London. I have spoken for them once each year since July 2006.
For my topic last month I decided to compare the published accounts of two Islamic banks. I wanted to bring out the difference between retail banking and corporate and investment banking which is often insufficiently understood by students. I also consider that too much discussion of Islamic finance is at a very abstract level and wanted a lecture that was grounded in factual information. It also enabled me to show the audience how much one can learn from reading published accounts.
As I always speak to slides without having any written text, this page does not reproduce exactly what I said during the lecture but it covers the same ground. The full slide pack is available for download.
IIBI has now made a 26 minute video of my presentation available.
I began with some disclaimers to make the ground rules clear:
- Finance is a complex subject and almost all issues require specific professional advice.
- Nothing in this presentation is intended to constitute professional advice.
- The presenter accepts no responsibility to anyone who may act, or refrain from acting, as a result of anything shown or said during this presentation.
- The speaker has had extensive contact with both banks mentioned in this presentation.
- No private information has been used.
- All information in this presentation is taken solely from the published accounts of the two banks.
Before looking at the published accounts, I reminded the audience that banking is a business and covered the four main sources of income for a bank.
At its simplest, banks provide you with the service and charge you. For example the bank may provide you with a safe deposit box and charge you either annually or charge a fee each time you access the safe deposit box. Until recently it was common for banks to charge customers for each cheque that was processed.
Banks, especially investment banks, may purchase investments which will produce a return in the form of dividends and capital appreciation.
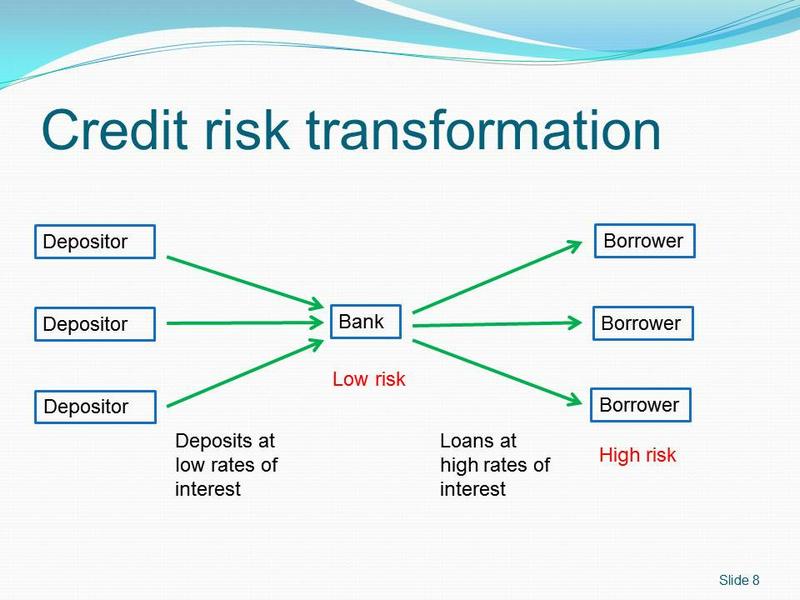
Depositors put money into banks either for safekeeping or to receive a return in the form of interest. As banks are generally perceived as low risk, they pay relatively low rates of interest to depositors for the money which depositors are lending to the bank.
Banks then lend that money to borrowers which may be either business borrowers or individuals (for example home mortgages). Such borrowers are typically regarded as high risk and the bank is able to charge borrowers a higher rate of interest than it is paying to depositors. This spread between the bank's lending rate and deposit rate is a key source of income for the bank.
It is not practical for depositors to lend directly to the borrowers due to the level of risk involved. However the bank is able to average the risk of many borrowers and also provides a cushion to depositors in the form of the bank’s capital which bears the first risk if borrowers default.
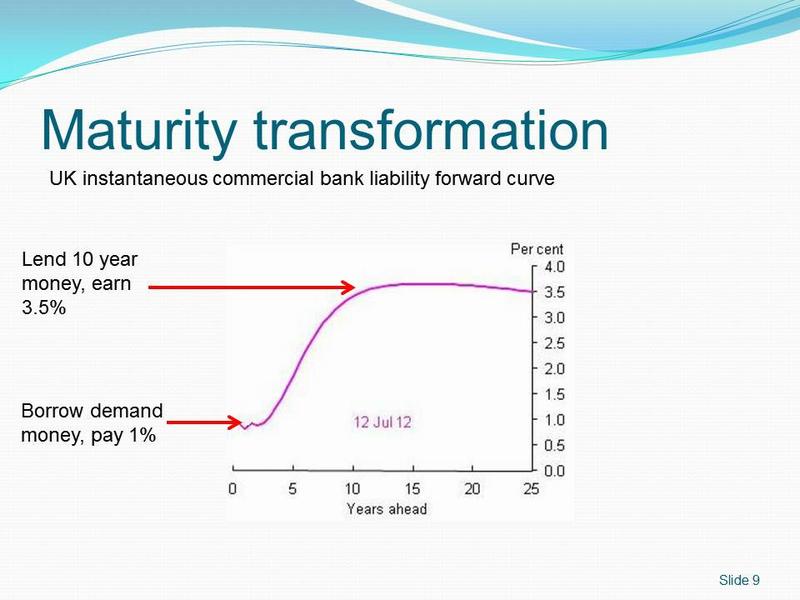
This slide from the Bank of England website shows the commercial bank liability yield curve on 12 July 2012. If a bank borrows money from depositors which is repayable on demand, it will typically pay interest of about 1% per year. If it lends this money for 10 years it will earn about 3.5% per year.
There is of course a risk involved in this maturity mismatch since if all depositors want to withdraw their money, the bank will not be able to repay them since its ten-year lendings cannot be liquidated. However where bank has a large widely dispersed deposit base, the risk of all of them withdrawing their deposit at once is unlikely although it happens occasionally as with Northern Rock in 2007.
I stressed to the audience that Islamic banks fulfil exactly the same role as conventional banks and make their money in broadly the same way as do conventional banks.
The difference is that Islamic banks conduct their business activities in accordance with the requirements set by their Shariah Supervisory Board.
In the discussion below, for brevity I occasionally refer to the banks lending money. Islamic banks do not lend money, but they do engage in Shariah compliant transactions which have the same economic effect as lending money.
Once I had set the scene by reminding the audience what banks do, I proceeded to review the accounts. These are freely available from the websites of Islamic Bank of Britain (IBB) and Bank of London and the Middle East (BLME).
The next two slides reproduce the principal activities note from the latest accounts with some text highlighted by me.
IBB principal activities
Islamic Bank of Britain PLC (the ‘Company’ or the ‘Bank’) is an Islamic retail bank in the United Kingdom established and managed on a wholly Sharia compliant basis.
The Bank offers a range of Sharia compliant banking solutions for both individual and business customers including current accounts, savings accounts, Home Purchase Plans and business financing. These are delivered through the Bank’s network of branches and agencies, which is complemented by internet, telephone and postal banking channels. In order to widen the access to potential customers and improve its reach in the market, these products are also offered through independent brokers.
The distinguishing feature of a retail bank is the focus on “individual customers” who are mentioned before "business customers". As there is a network of branches I would expect the bank to have a high cost structure since branches are expensive.
BLME principal activities
Bank of London and The Middle East plc was originally incorporated in the United Kingdom on 7 August 2006 (as United House of Britain plc) and received FSA authorisation to launch and start trading as a bank in the City of London on 5 July 2007. BLME, an independent wholesale bank, provides a range of Sharia’a compliant banking services and advice to businesses and individuals, with a strong focus on Europe, the Middle East and North Africa regions, requiring access to innovative Islamic financial products.
BLME operates as a wholesale bank and emphasises its focus on "Europe, the Middle East and North Africa regions." Many investment banks are based in London but operate internationally. The reason why they are based here is access to professional skills. (This is explained in more detail on my page the role of the UK as an international centre for Islamic banking and finance.)
The level of management continuity is normally quite informative. Successful organisations typically have greater management continuity than organisations which are struggling.

Without looking at any other information, the above slide suggests that IBB has faced more business difficulties than has BLME.
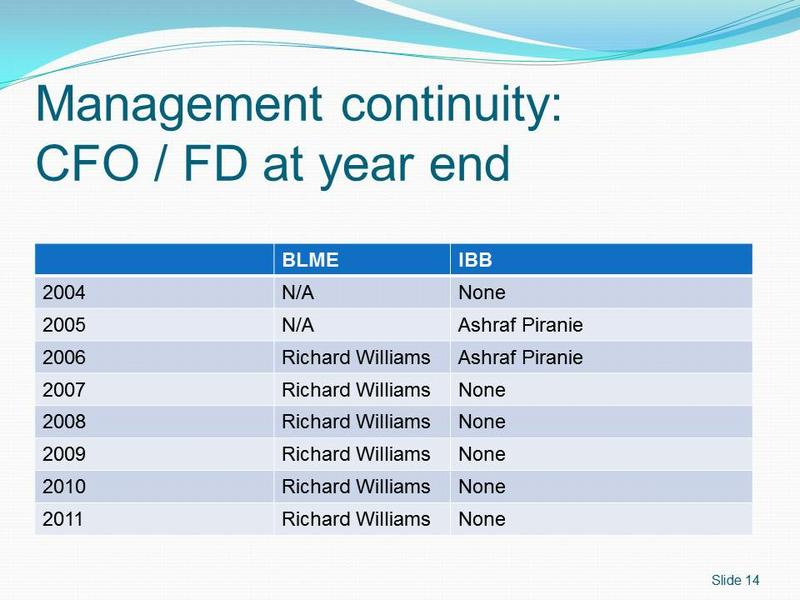
Again BLME demonstrates complete continuity in the role by Richard Williams.
In the case of IBB, until I prepared the slide I had not focused on the fact that after 2006 it has not had a person who is a director of the company and is responsible for finance. From my knowledge of IBB I was aware that they had a "Head of Finance" and indeed the Financial Services Authority would not allow the bank to operate without a Head of Finance. However the accounts showed that he was not a member of the board. This suggested to me that IBB did not place sufficient emphasis on the role since the Head of Finance was not given the status of a director of the company.
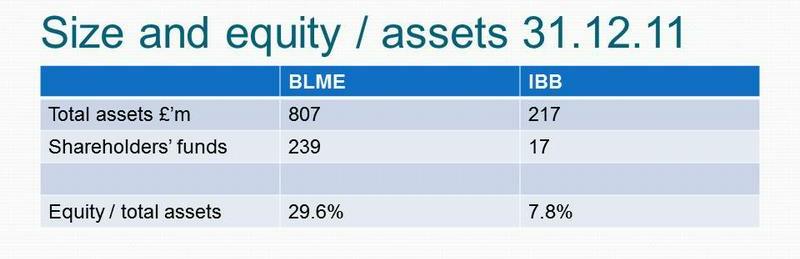
One way of assessing the size of a bank is to look at its total assets. This slide shows that BLME is approximately four times as big as IBB. However it has over 10 times the shareholders' funds, and therefore a much higher ratio of equity/total assets. The lower equity ratio of IBB suggests that IBB will be much more risk averse than BLME.
Taken together these two slides show how different are the businesses of the two banks.
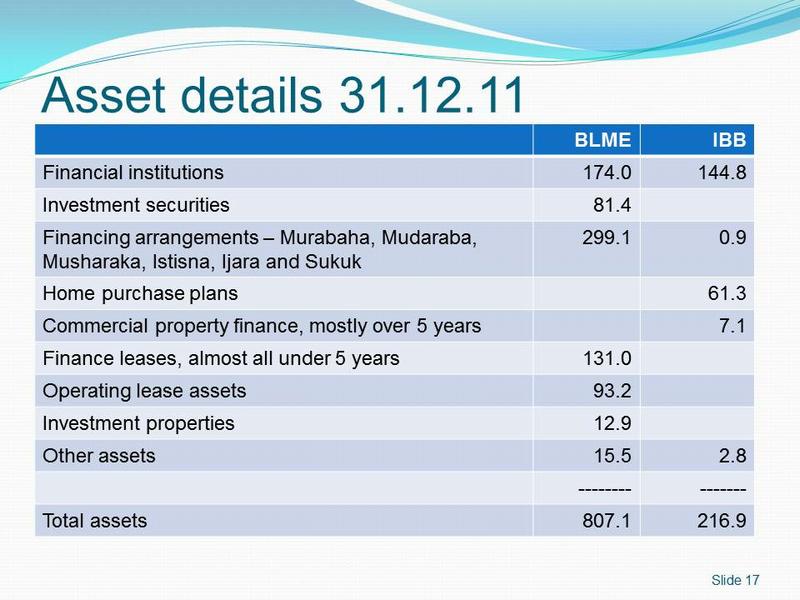
The key assets to look at on the BLME balance sheet are the investment securities, the financing arrangements, the finance leases and the operating lease assets. All of these represent assets that BLME has chosen to own for their expected financial returns. Apart from BLME shareholders’ funds of £238.7 million, the remainder of the assets are financed primarily by taking deposits from other financial institutions, although there are also some deposits from customers. Accordingly it would be appropriate to describe BLME's business as being asset driven; the liabilities to the financial institutions are a kind of balancing number. Essentially BLME acquires the assets and then takes interbank deposits to finance them.
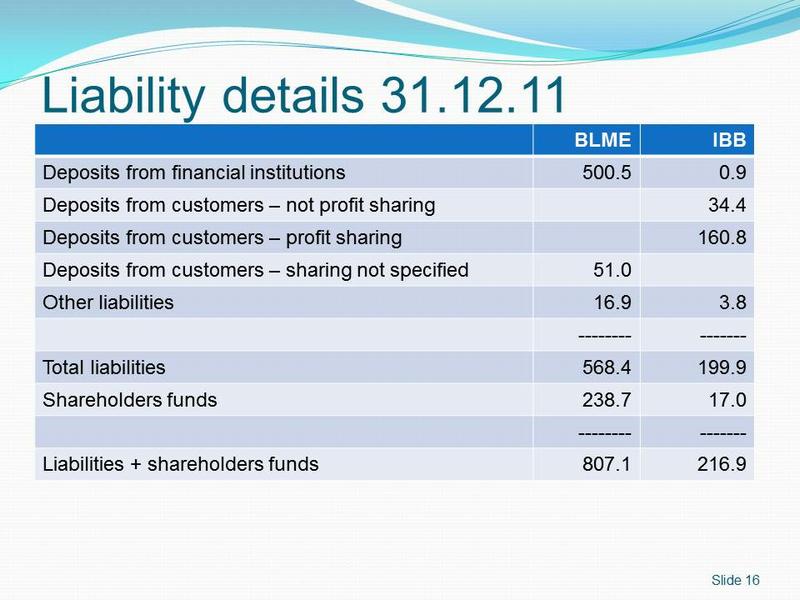
The dynamics of the IBB business are the opposite. Virtually all of the liabilities are deposits from customers. The not profit-sharing deposits are likely to be customer current accounts while the profit-sharing deposits will be customer savings accounts. When you operate a retail bank it is in practice impossible to turn away customer deposits. (You can of course discourage customers from depositing with you by paying lower rates of return but you cannot refuse money the customer wishes to deposit with you without losing the customer.)
Once IBB has taken the deposits, it needs to decide what to do with them. The asset details show that IBB has used £61.3 million to finance home purchase plans and £7.1 million to finance commercial property. However virtually all the rest of its deposits received have been used to make deposits with other financial institutions. While all banks maintain some deposits with other financial institutions for liquidity management purposes, the deposits held by IBB of £144.8 million far exceed what it needs to hold for liquidity management.
Accordingly, I would describe IBB as a liability driven business. Deposits come in from customers and then IBB needs to decide the extent to which it can acquire assets that deliver a meaningful financial return. The balance un-invested is deposited with other financial institutions.
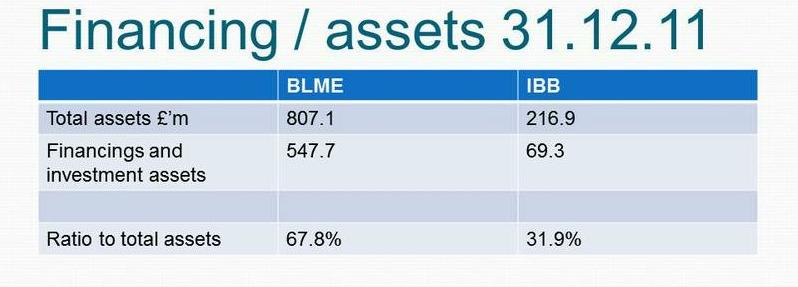
This slide shows that financings represent 67.8% of the total assets of BLME. This looks like a relatively normal ratio. However for IBB financings represent only 31.9% of total assets which is a relatively low ratio. This indicates that IBB is not able to lend out the deposits that it receives. This could be either because there is insufficient borrowing demand from customers or because the customers who do want to borrow are regarded as too risky to finance given IBB's relatively low equity ratio.
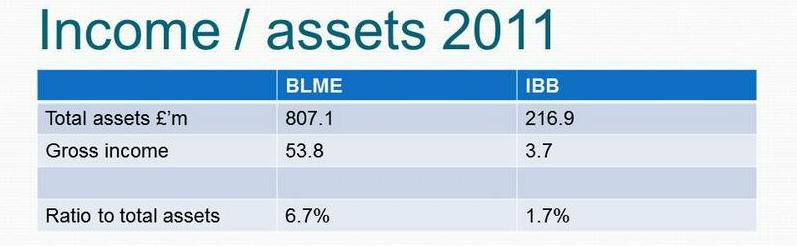
BLME earns a much higher return on total assets than does IBB. This reflects the much higher proportion of BLME’s assets which represent financings (as opposed to deposits with other financial institutions) than is the case with IBB.
To avoid over-complicating the lecture, I did not attempt to compute the rate of return on financing assets for the two banks. However the ratios from the 2011 accounts are as follows:
BLME |
IBB |
|
| Total customer financings £'m | 547.7 |
69.3 |
| Gross income from financings £'m | 52.7 |
2.7 |
| Income / financings | 9.6% |
3.8% |
This shows that as well as BLME being able to deploy more of its funds in customer financings of various types, it earns a higher return on those assets than does IBB. Conversely this higher rate of return suggests that the BLME financings are more risky than are IBB's financings, since risk and return tend to go together.
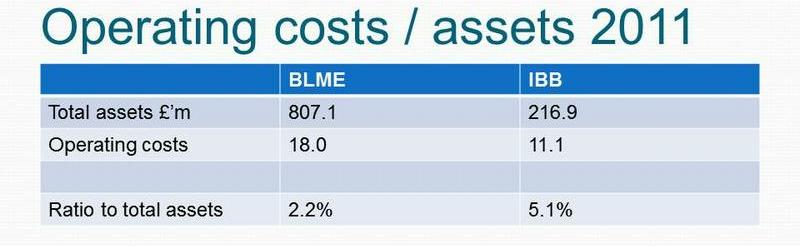
IBB's operating costs represent 5.1% of its total assets compared to 2.2% for BLME. In my view this arises from the cost implications of running branches and also the fact that all banks need some level of central overheads (for example a central finance function and a central compliance function) which IBB has to spread over a much lower asset base than does BLME which benefits from economies of scale.
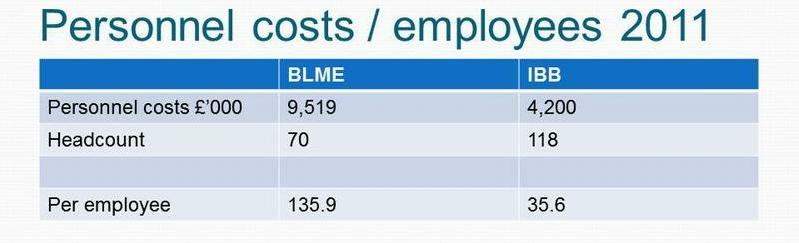
The average personnel cost per employee shows the very different nature of the two banks. Most of the BLME staff will be either bankers taking commercial decisions about what assets BLME should acquire, or they will be senior administrative personnel such as the head of compliance or the chief financial officer. A relatively small number will be support staff such as secretaries. Accordingly it is no surprise that the average cost per person is over £135,000 per year.
Conversely IBB will have many staff in its branches. That is also demonstrated by having 118 employees for a bank that has one quarter of the assets of BLME. Few if any of these branch staff will be making significant commercial decisions on behalf of IBB; their main role will be either transaction processing (taking or receiving money over-the-counter) or dealing with customer applications in accordance with the criteria set by IBB's head office. Accordingly it is no surprise that the average cost per person is only £35,600.
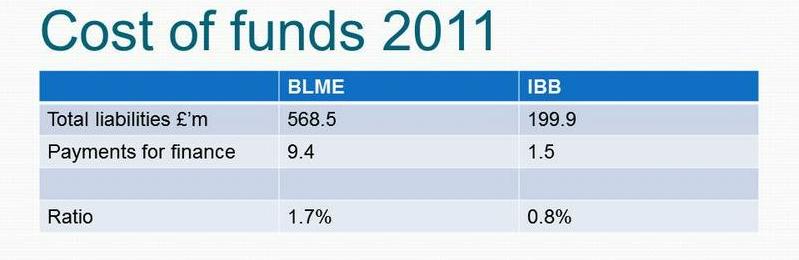
As almost all of IBB's funding comes from retail customer deposits, it is no surprise that the average rate of payment to customers for this money is only 0.8% per year. Conversely virtually all of BLME's funding comes from the interbank market where it has to pay a commercial rate of return which explains the reported cost of 1.7% per year.
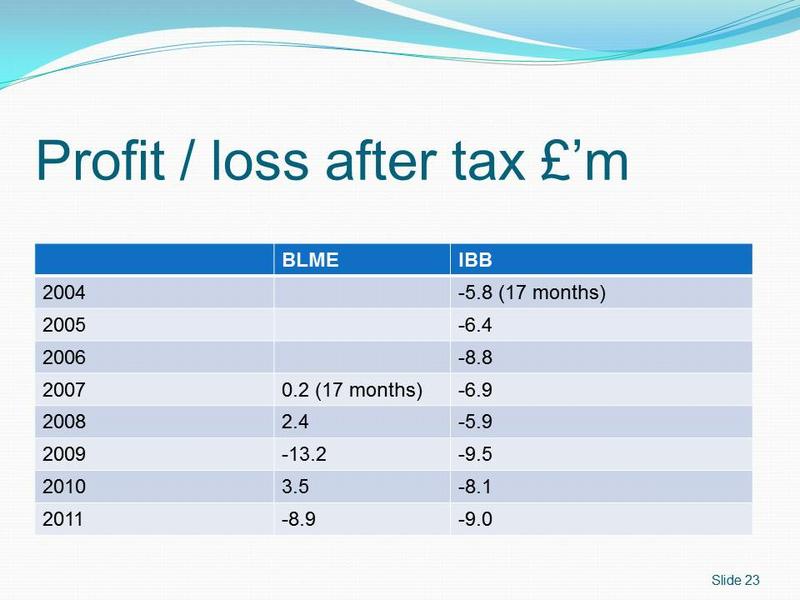
This slide sets out the end results of the business issues discussed above.
IBB has lost money at a relatively consistent rate every year since it was established. In my view the figures are showing that IBB has a significant level of relatively fixed operating costs in its head office function and in its branches, but has failed to generate sufficient income from it financing activities to cover these operating costs.
The picture with BLME is more mixed. In some years BLME has made a small profit. However that profit does not represent an adequate rate of return on its shareholders' funds. For example the current level of shareholders’ funds is £239 million. Most banks would regard a rate of return of 10% on shareholders’ funds as being rather low. However the highest profit earned by BLME of £3.5 million represents only 1.5% of the £239 million shareholders’ funds.
Furthermore in two years, 2009 and 2011, BLME has reported a significant loss.
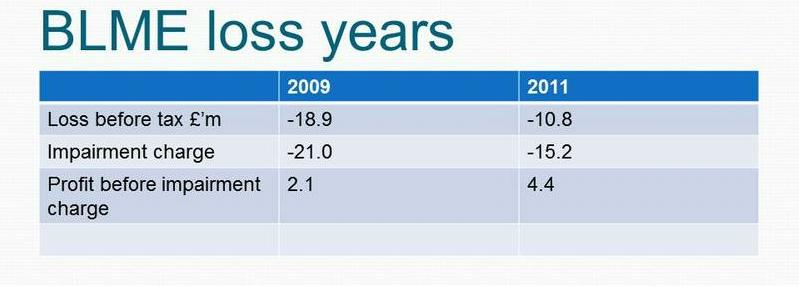
The above slide shows that the loss in those years was entirely attributable to the impairment charge. An impairment charge arises when a customer ceases to make contractually required payments to the bank so that recoverability of the financing to the customer is no longer assured.
The following slides repeat what the BLME accounts state about the impairment charges. It can be seen that the impairments arise on a relatively small number of accounts. That shows the nature of corporate banking where relatively few transactions are undertaken but each transaction tends to be of a significant size so that even a few transactions turning sour can lead to significant losses.
BLME 2009 impairment charges
As at 31 December 2009, four facilities (3 individual and 1 collective) comprising amounts due to the Group of £37.2 million were determined to be impaired.
As at 31 December 2009, the individual provisions are against the transportation sector ($4 million /2008: $1.2 million),Sukuk issued by a Saudi based company ($18.5 million) and a European manufacturing business (€2.5 million).
The collective provision of $3 million (2008: $0.27 million) is against a US finance lease portfolio in the transportation sector.
BLME 2011 impairment charges
As at 31 December 2011, 6 facilities (5 individual and 1 collective) comprising amounts due to the Group of £40.4 million (2010: 4 facilities totalling £20.8 million) were deemed to be impaired.
As at 31 December 2011, the individual provisions are £3.4 million ($5.25 million) against the transportation sector (2010: £2.6 million / $4 million), £2.1 million (€2.5 million) in respect of a European manufacturing business (2010: £2.2 million / €2.5 million), £0.5 million against the UK real estate sector (2010: £nil), £0.3 million ($0.5 million) against a Sukuk issued by a Bahraini based company (2010: £nil / $nil) and a £14.6 million (€17.5 million) provision against a Turkish manufacturing business (2010: £nil / €nil).
The collective provision of £0.5 million ($0.7 million) is against a US finance lease portfolio in the transportation sector (2010: £1.5 million / $2.3 million).
My concluding comments were intended to remind the audience that the similarities between Islamic and conventional banks are far greater than their differences.
- Islamic banks are businesses whose responsibility is to maximise shareholder value.
- They face the same commercial challenges as conventional banks.
- Success for both types of banks requires the same skills: clear strategy, risk management, HR management, customer segmentation etc.
Follow @Mohammed_Amin

